Platforms
Models people can operate.
A report is read once. A platform is used every planning cycle. Each of these began as an analysis someone needed again, and each is built to be run by the team that depends on it, with its limits stated on the screen.
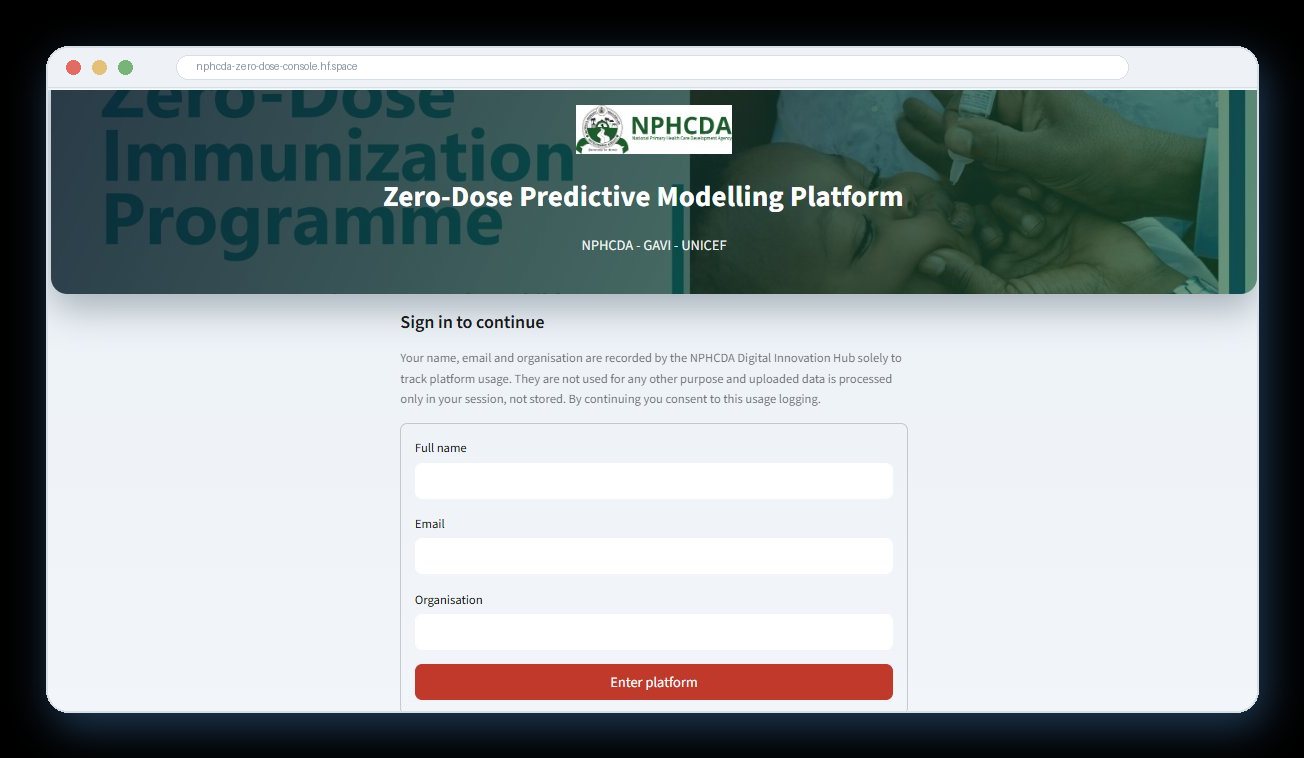
ZARA
Zero-dose Analytics and Risk Assistant: the analyst inside the national zero-dose platform.
ZARA answers plain-language questions about the national zero-dose model in English, French, Hausa, Yoruba, Igbo, Pidgin, Swahili and more, so a state immunisation officer can ask which of their local government areas (LGAs) is at risk, and why, without writing code or reading a statistical appendix.
What makes it usable in government is what it is not allowed to do. ZARA reads only the live model outputs and the documents uploaded to the platform, cites those documents by page, and is instructed never to invent a number. Every estimate comes with its uncertainty, and LGA answers are labelled as calibrated estimates, not observations. An assistant that occasionally fabricates a confident number is worse than none, because the failure is invisible to the person least able to catch it.
How the routine immunisation team uses it
- Microplanning. The ranked LGA list and vaccine-risk calendar go straight into annual routine immunisation workplans.
- Barrier-matched packages. Filter by state or LGA to see each area's measured barriers, profile and candidate response, then export to Excel.
- Campaign and supervision routing. Hotspot and burden ranks choose campaign areas and supervision routes; early-warning flags send supervision to the exact antigen, month and LGA.
- Beyond immunisation. Many high-risk LGAs also need nutrition and antenatal care, so one visit can deliver several services.
- Meeting-ready documents. A Gavi-style factsheet and a Word policy brief regenerate from the same live outputs, so the report, brief and deck never drift apart.
Guardrails on every view
Data date, reporting completeness and an estimate label beside each figure; secure sign-in with usage tracking; data kept in session; and a load, validate, run, review, approve and release cycle owned by the agency's Digital Innovation Hub.
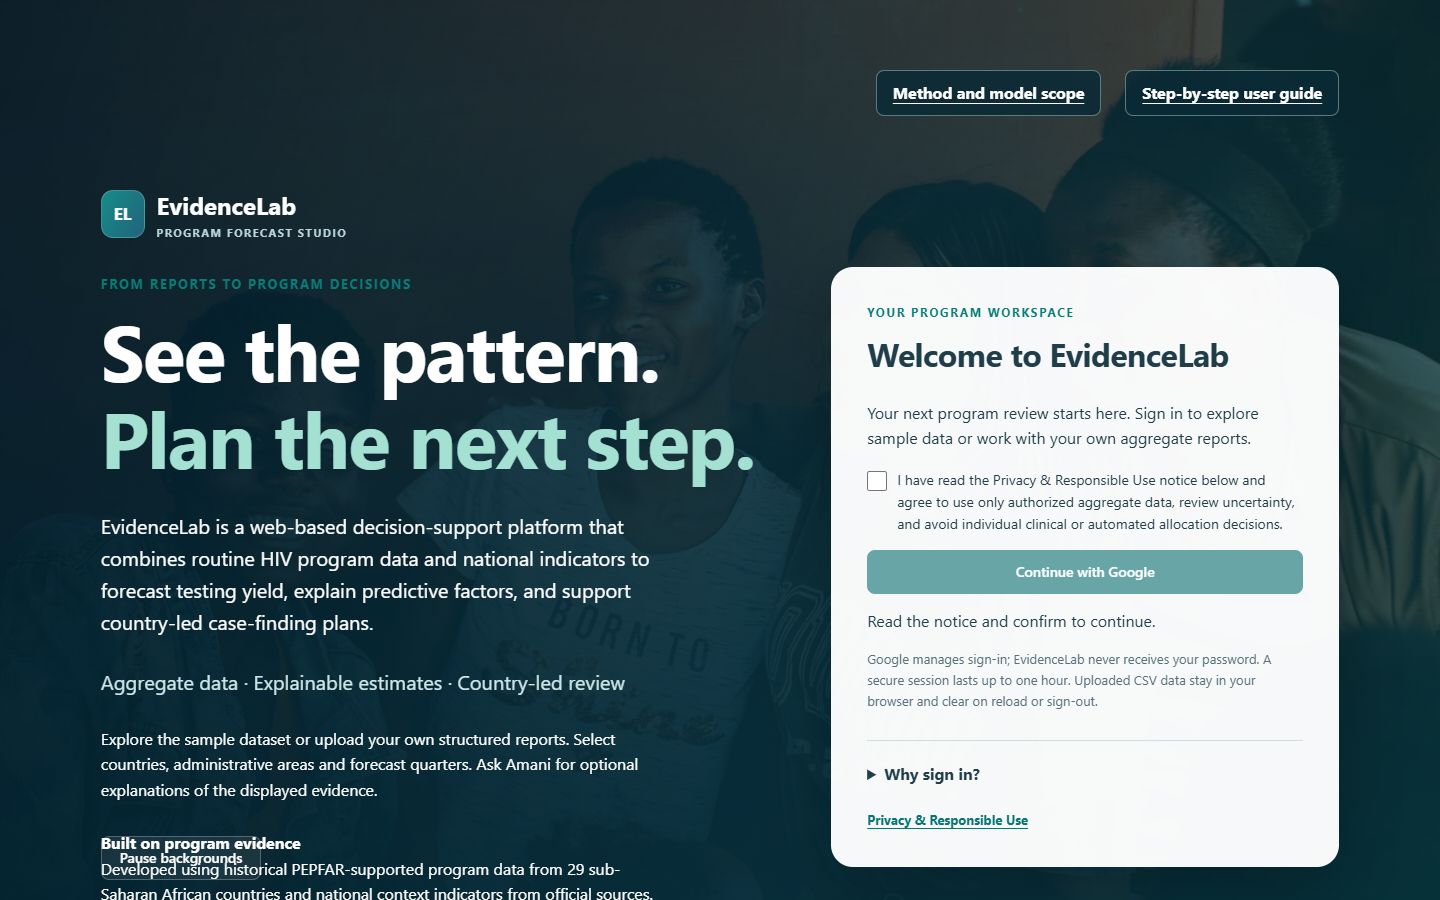
EvidenceLab
Program Forecast Studio
A decision-support platform for country-led HIV case-finding plans. It combines routine PEPFAR programme reports with national context indicators to forecast HIV testing yield one to four quarters ahead for every reporting unit, age band and sex, explains what drives each forecast, and turns the forecast into a testing plan.
- Target planning. Enter planned tests or a target number of positive results and see the expected positives, the yield-based range and the testing volume needed.
- Subnational review. An Africa overview and named reporting-unit maps, weighted by prior HIV tests, show where yield is expected to rise or fall.
- Explanations. Exact TreeSHAP values from the same model that makes the forecast show which programme history and national indicators push each estimate up or down.
- Honest uncertainty. Prediction intervals with 93 to 94% empirical coverage across horizons, and a validation workspace that checks forecasts against a team's own later reports.
- Your data stays yours. Teams upload their own aggregate reports; parsing, forecasting and explanation run in the browser, and uploads are never retained.
- Amani. An optional assistant that explains the displayed evidence in plain language.
Developed on 87,946 records from 296 reporting units in 29 sub-Saharan African countries, 2020 to 2024. Four-quarter error is 20% lower than carrying the last quarter forward; one quarter ahead it is no better, and the model card says so.
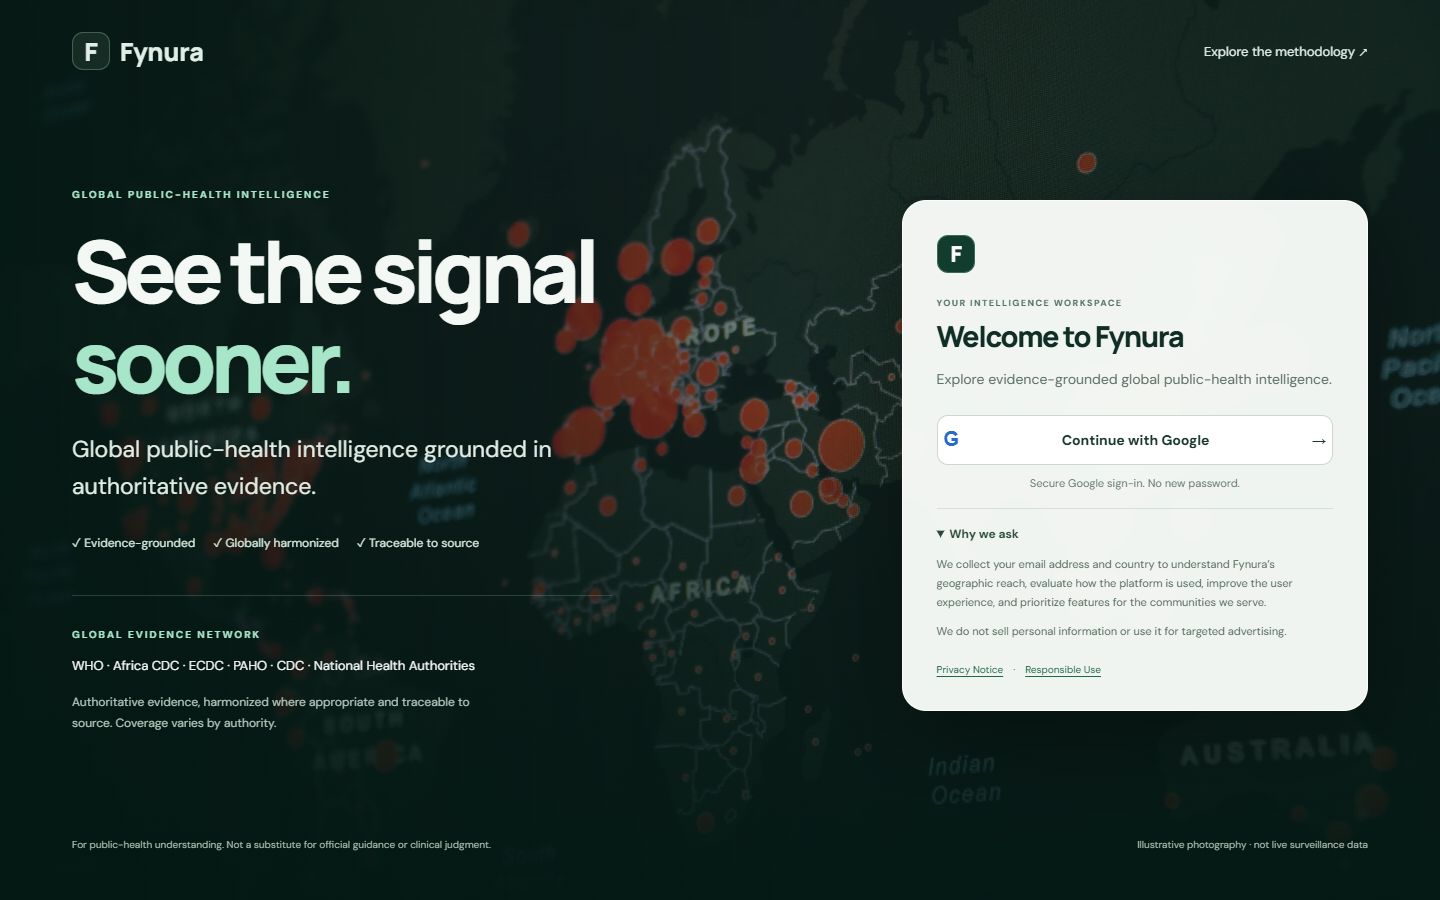
Fynura
See the signal sooner.
Epidemic intelligence that monitors verified public-health signals from WHO, Africa CDC, ECDC, PAHO, CDC and national authorities, including the Nigeria Centre for Disease Control and the Kenyan and Ugandan health ministries.
- Separate agents for discovery, extraction, verification, epidemiological analysis and communication
- A deterministic confidence score from source authority, recency, completeness and agreement
- Event, reporting, publication and retrieval dates kept apart; conflicting values shown, never averaged away
- CUSUM early-signal detection with an inspectable baseline and threshold; sourced briefs and infographics
More platforms
Each is labelled by maturity. Some are live; some are research platforms; one is in development.
EpidPredict
Forecasts sub-national HIV cascade indicators for PEPFAR programmes with a Bayesian Beta regression, so every forecast stays inside the 0 to 100% bounds of the indicator and carries a 95% credible interval. Covariates are screened for multicollinearity before fitting, and an AI interpretation layer may only describe the posterior medians, credible intervals and evaluation metrics the model has computed, with guardrails against unsupported inference.
Validated on PEPFAR data from Nigeria, Ghana and Cameroon, 2018 to 2024, with forecasts to 2028: median RMSE 1.88% (range 1.11 to 2.20%), R-hat below 1.01 for every model, and a mean bias of 0.85% in Bland-Altman agreement. Built for resource allocation, commodity forecasting and district planning.
Presented with Dr Emeka Okechukwu at AIDS 2026, the 26th International AIDS Conference. The open-source code will be released on peer-reviewed publication.
StrokeRisk AI
Ranks the hypertension patients in a primary-care clinic by stroke risk, using clinical information a routine visit already records, so scarce follow-up capacity reaches the people most likely to benefit. Developed on patient-level records from more than 10,000 adults managed for hypertension in Nigeria, with guidance available in 11 languages.
Internal validation: out-of-fold AUC-ROC 0.776 and 85.3% detection, equal for women and men. Prospective external validation is underway.
A non-diagnostic screening aid. Every output is reviewed by a clinician, and clinical judgement always takes precedence. Patent application in progress.
Evidence Assistant
Retrieval over a governed corpus of WHO strategic information guidelines, PEPFAR MER indicator guides and Nigeria DHS documentation. The provenance layer makes every statement traceable to its source document, which is what keeps it usable for indicator definitions, where approximately right is the same as wrong.
AlignInsight
A three-layer framework for detecting deceptive alignment and evaluation awareness in large language models across ten healthcare vulnerability domains: the failure mode where a model behaves safely because it detects it is being tested. Keyword filtering missed 83% of high-risk outputs; semantic analysis reached full detection with perfect expert concordance (κ = 1.00).
SignalSifter
An exploratory analysis and feature-engineering environment with an integrated analysis agent, so frontline analysts can find high-impact drivers and test variable relationships across complex datasets without starting from a blank notebook.
Start a conversation
Need a model your team can run? Tell us what it has to decide.
We build for handover from the first week: code, documentation, training and a sign-off cycle your organisation owns. Platforms without public links are available to partners on request.